NOISE
First we need understand the nature of the Beast. To do so, we have to get past all the noise. Investors want to make money on their investments. To try and do so, they rely on sources of information. Each of those sources have their own agenda.
- The Business of Investment Advisors is to earn fees from their clients.
- The Business of TV and Internet investment shows is to gain viewers in order to sell advertising to advertisers.
- The Business of Newsletters and Advisory vehicles is to gain readership.
Having a grasp of the underlying motives helps the reader understand why the sensationalism is so rampant. Big headlines and big announcements get attention. That is good for the person grabbing the attention. That is not necessarily good for the investor.
The current noise is promoting fear to get attention by outlandish claims that the stock market is overvalued and poised to tumble. Sell your stocks. Be defensive and so on. The noise is being promoted to get attention, not because it is wise investment policy. Let’s take a look at where the market really is.
NOISE ABOUT THE INDEX BEING OVERVALUED
The first chart below is a simple one. It shows the DJIA over the last 10 years, including the 2008 disaster.
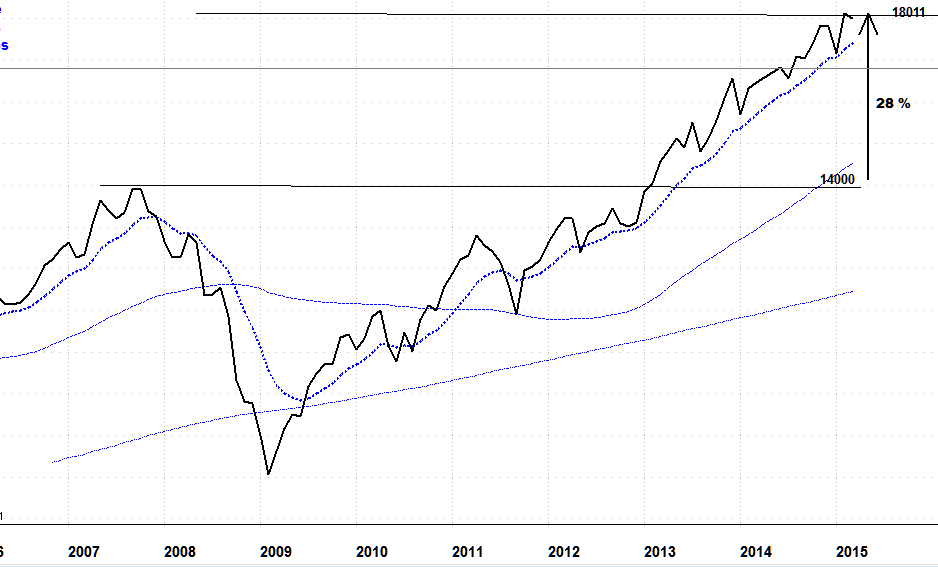
Now if you look at the current level in isolation, it looks like a high number. The DOOM & GLOOM pundits are predicting a crash saying that this economic cycle has over-stretched itself. But look again!!! The current high of 18,011 is exactly 28% over the previous high. 28% does not make an over-extended cycle. In fact 28% is closer to an average gain in normal times.
One of the basic beliefs of experienced investors, is that when a bubble bursts, the value will usually fall between 1/3rd and 40%. Since the current market has not risen that much, it is hard to imagine it falling that much.
Now compare the change in the average during the last 25 years.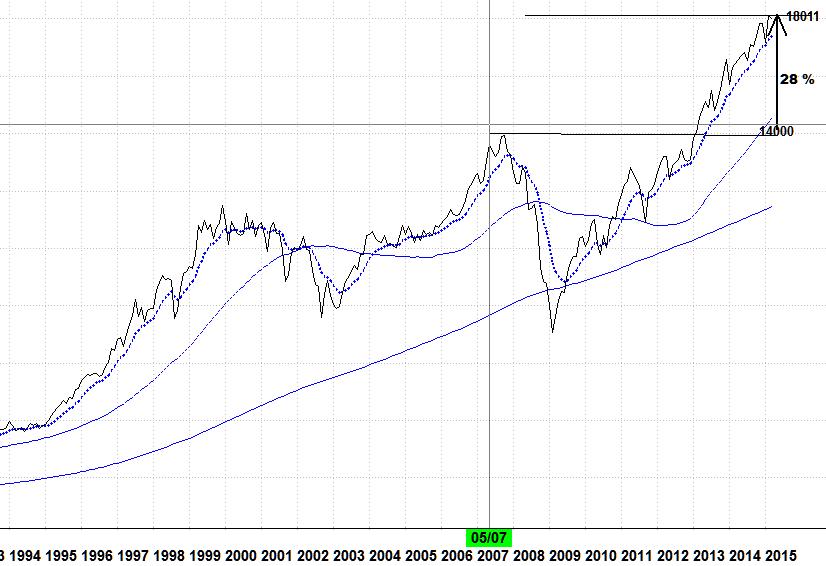
In the previous cycle, the Average went from 11,400 to 14,000, a rise of 23%. If you averaged out the peaks and valleys of the current rise, it really has not risen that much over the previous peak, and most certainly not in the ‘bubble’ range. Compare that to the last cycle and what you can see is that in a more lengthy period, the rise is roughly in line with historical norms. What makes it scary at first glance is the rise from the horrific lows of 2008. When that abnormality is removed, the comparisons look very reasonable.
2008 was an extremely unusual year. The financial world froze over because of the excesses of Wall Street, and the horrific plunge in all values of all assets was greater than anything previously experienced. While there will be future financial crises (there have always been financial crises), nothing on the current horizon is even remotely similar to the circumstances of 2008.
The world is a different place than it was before the great meltdown. Banks and large financial institutions are now closely scrutinized and must be much better capitalized then in 2008. They have to pass yearly stress tests that become more onerous yearly. Derivatives are now bought and sold for specific purposes, rather than just to convince unwary investors to make a quick buck. Real estate values have marginally, but only marginally, recovered. There is no excess mortgage lending that is inflating real estate values. Worthless mortgage bonds with false AAA credit grades no longer exist, except where they are undetected. Credit Agencies granting worthless credit are now extremely wary of carelessly granting credit standings.
There does remain an area of large concern, and that is the massive amount of debt that exists all around us. Every government now has record debt on its books. If you believe that this debt is unmanageable, then there is room for concern. However, as the economy around the world continues to improve and dig itself out of the damage done by 2008, we believe that this debt is manageable and will gradually right itself over the future.
WHAT MAKES THIS RISE SEEM DRAMATIC
When the stock markets melt down totally as they did in 2008, the rise from that meltdown is quite dramatic, but appearances can be deceiving. When we all thought the world had come to an end, all stocks became relatively worthless. The largest part of the rise was from that low point reached in 2008.
Another way to have a realistic look
The Index was 11,400 upon the dawn of the new century. It had then reached a high that it didn’t surpass again until 2006. If you calculate the average yearly gain from year 2000 to year 2015, it is a rise in the Average of 3% per year over that 25 year span.
Pretty modest isn’t it.
Let’s measure from peak to peak. The peak of 11,400 was reached in January 2000. The next peak was reached in September 2007 at 14,000. Again, that is approximately 3% per year.
Let’s measure from the last peak to this peak – 14,000 in September 2007 to 18,100 in March 2015. Again, slightly over 3% per year.
This doesn’t sound like a bursting bubble to me!
WHAT IS TOO EXPENSIVE
As in every cycle, the stock market wildly over-reaches when a stock is hot. It usually rises until it far exceeds its real value, and then it either crashes or drifts down to earth. It is certainly true that some stocks have reached this point. It is also true that there are numerous bargains and excellent values out there.
If you want to find some of those great bargains, stay tuned.
Our Current Pick
General Electric (GE) – currently $25.12 US$. We will explain why soon.

This website and authors’ opinions are intended to be informative, but information contained is not guaranteed as being accurate or a complete statement or summary of available data. We assume no responsibility for errors, omissions, or contrary interpretation of the subject matter herein. Any perceived slights, omissions, or mis-statements of persons, peoples, or organizations or other published materials are unintentional. This information is not intended for use as a source of legal, business, accounting or financial advice, & readers are advised to seek services of competent professionals. No representation is made or implied that the reader will do well from using the suggested techniques, strategies, methods, systems, or ideas; rather information is presented for news value only. We do not assume any responsibility or liability whatsoever for what you choose to do with this information.
We may or may not have positions in securities we name. In making an investment decision consider numerous factors such as portfolio balancing, timing, cash and capital reserves, asset allocation and other. Do your own research. Matters discussed contain forward-looking statements that are subject to risks and uncertainties and actual results may differ materially from any future results, performance or achievements expressed or implied. Views expressed are opinions and not investment advice. You should retain a licensed professional to guide you. This report is neither a solicitation nor a recommendation to buy or sell securities. We are not a registered investment advisor nor a broker-dealer.